Visualising the APIs
for KPIs
My Role
Lead Designer,
Lead Researcher,
Mentor
Duration
Planned - 6 months
Actual - 8 months
Design Team Size
3 (Researcher,
Junior designers)
Key Responsibilities
Led the research and design
Collaborated with product management to shape the product roadmap from a design perspective
Actively mentored and developed design team members throughout the project
Problem statement
M2P's partners faced significant challenges in effectively managing and growing their payment programs due to fragmented and inaccessible data. This lack of a unified performance view and reliance on manual and time-consuming reporting processes with limited actionable insights was ultimately hindering data-driven decision making and operational optimization.
Goal
To empower M2P Fintech's partners with a comprehensive, intuitive, and self-service data visualization dashboard that provides a unified view of their program performance across various card types and make quicker decisions.
M2P's business partners faced significant challenges in accessing and analyzing their payment data, hindering their ability to effectively manage and grow their payment programs:
Challenges addressed
Data was scattered across multiple systems and tools, making it difficult to get a holistic view of program performance and requiring manual consolidation.
Partners relied on the operations team for custom reports, leading to delays, inefficiencies, and a high volume of support requests.
The existing reporting tools provided only basic metrics and lacked the depth and customization needed to uncover actionable insights and identify areas for improvement.
How?
Conducted interviews with key stakeholders and end-users to understand their reporting needs, pain points, and workflows for each payment program.
Coordinated with the concerned teams to align with the dashboard's goals, features, and overall vision for each program, ensuring a cohesive user experience while catering to unique requirements.
Led the design process, ensuring the dashboard's information architecture and visual design accommodated diverse data and metrics across payment programs.
Collaborated with fellow designers to conduct usability testing with potential users, and incorporated the feedback to refine the dashboard's filtering and customization capabilities. User feedback highlighted the intuitive layout, ease of navigation, and valuable insights offered.
Implemented solutions to address handling large volumes of transaction data (over 100K per day). Strategic design decisions included data aggregation and a queueing system for custom reports, ensuring smooth performance and timely delivery.
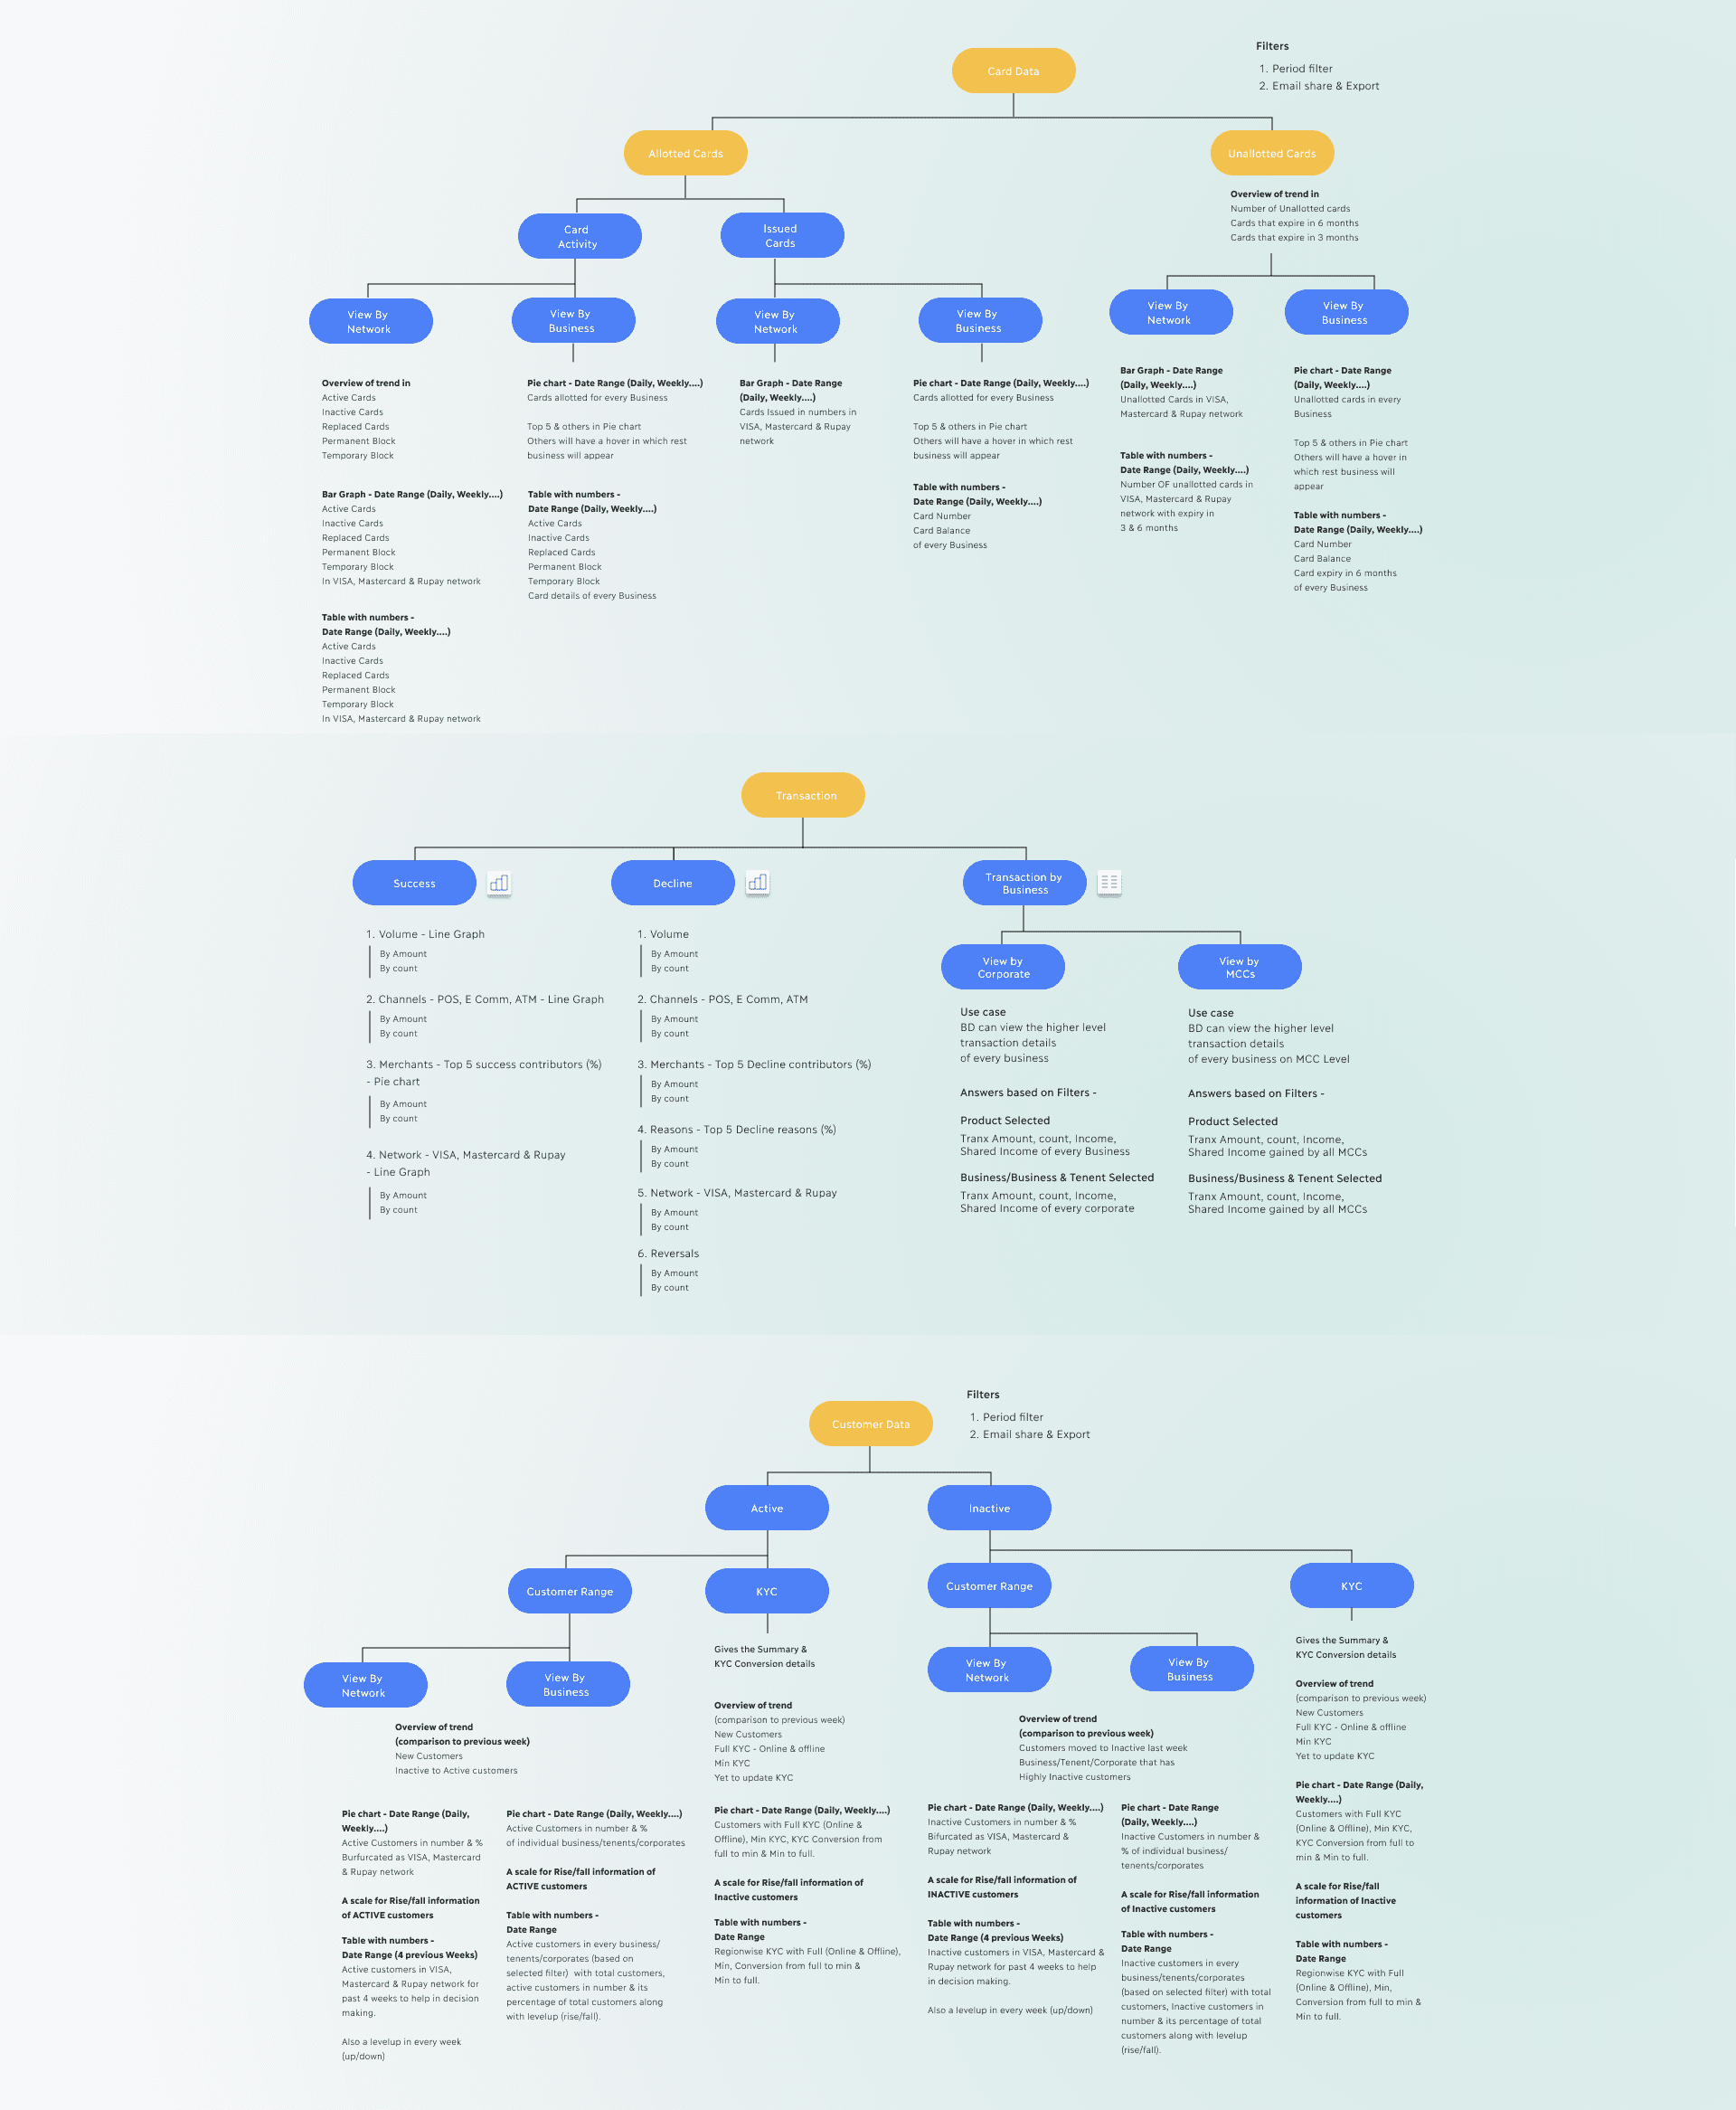
API flows to Product Information Architecture
The Integrated Products Dashboard delivered clear, actionable business insights from raw API data, offering partners a self-service view for swift, independent decision-making.

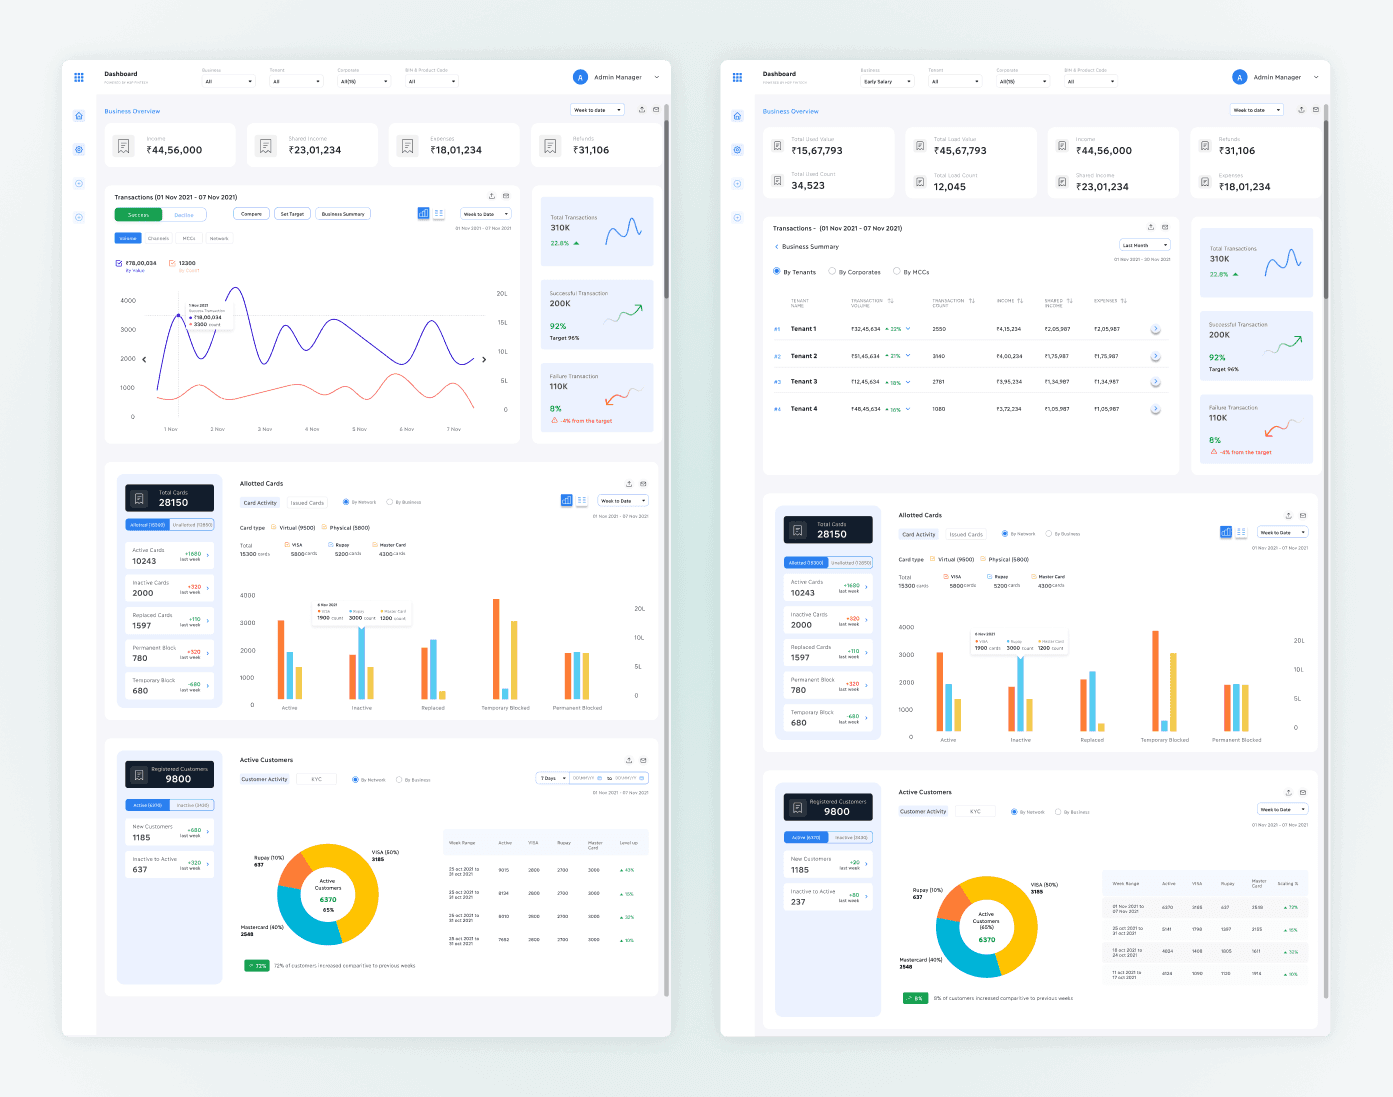
A quick snapshot of the Integrated Products Dashboard application
IMPACT
The Integrated Products Dashboard significantly improved the partner experience and empowered them with data-driven decision making, leading to the following tangible business outcomes.
Automated report generation saved the M2P's operations team approximately 35 hours per week. Further, the self-service functionality saved an estimated 30-90 minutes per report for Partners.
Streamlined workflows and significant reduction in the workload on the operations team was observed.
Partners expressed high satisfaction with the dashboard's ease of use, actionable insights, and ability to generate customized reports at their ease.
More snapshots from the Integrated Products Dashboard application